Value Stream Mapping

Definition
Value Stream Mapping
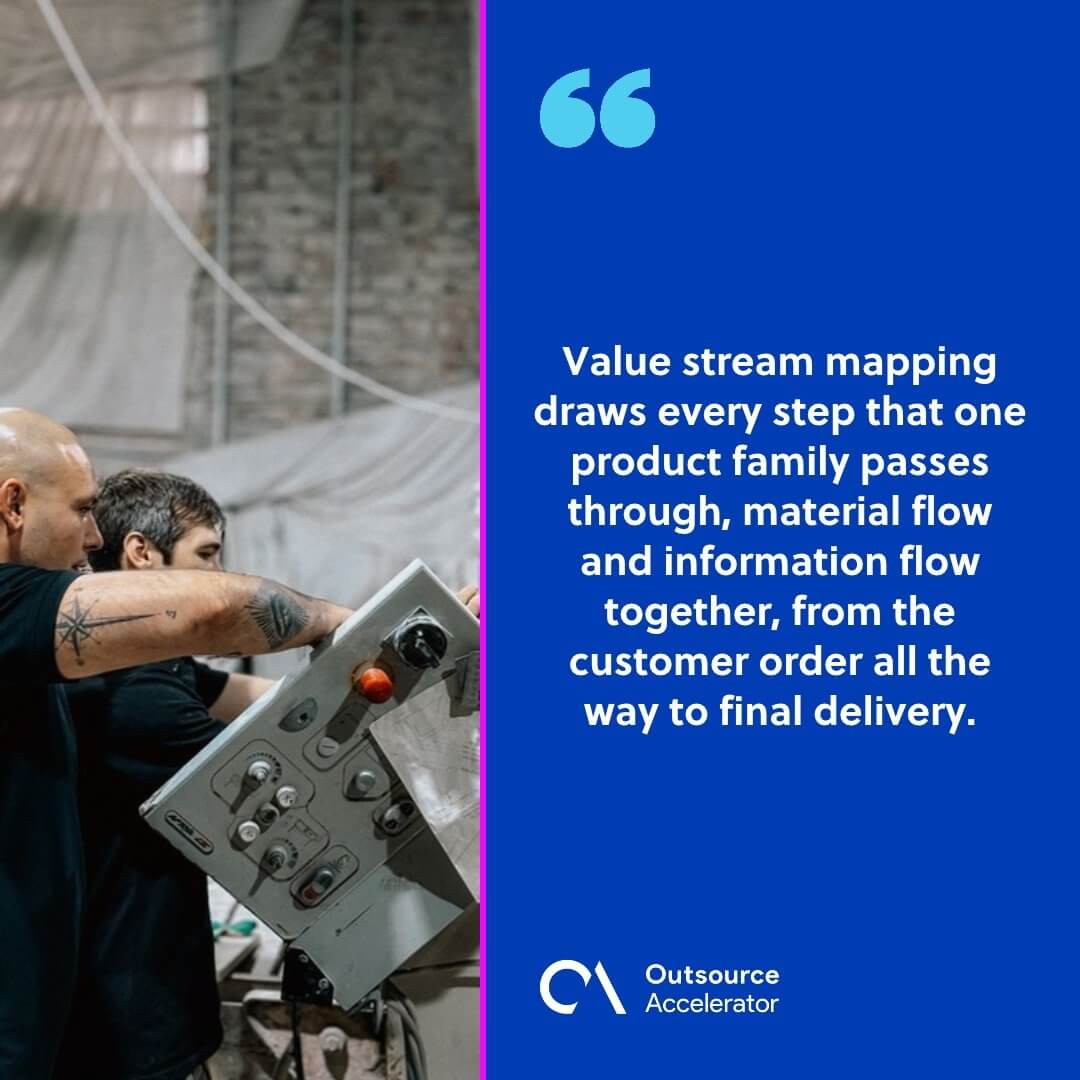
Value stream mapping draws every step that one product family passes through, material flow and information flow together, from the customer order all the way to final delivery. The map separates the time that adds value from the time that merely passes.
Toyota developed the tool inside its production system as a material and information flow diagram. Mike Rother and John Shook turned it into a teachable workbook with Learning to See, published by the Lean Enterprise Institute in 1998.
A mapping exercise produces two drawings. The current-state map records what genuinely happens today, not what the procedure says. The future-state map sets out the condition the team commits to reach.
Scope is deliberately narrow. One product family, one door-to-door flow, one map. Widen it to cover a whole plant — and the result becomes a wall decoration nobody acts on.
Key takeaways
- Value stream mapping charts material and information flow for a single product family, order through delivery.
- Current-state and future-state maps are drawn in pairs; the gap between them becomes the improvement plan.
- The timeline strip exposes how little of total lead time is actually value-adding work.
- Takt time sets the rhythm the future state has to meet, derived from customer demand rather than machine speed.
How it works
A team walks the flow backwards from the customer, recording each process as it actually runs. They capture cycle times, inventory sitting between steps, and the signals that tell every process what to make next.
The map is built from a small, fixed vocabulary.
| Map element | What it records |
|---|---|
| Process box | one area of continuous material flow |
| Data box | cycle time, changeover time, uptime and operator count |
| Inventory triangle | the stock waiting between two processes |
| Information arrow | the signal telling a process what to make and when |
| Timeline strip | processing time on the lower line, waiting time on the upper |
| Kaizen burst | a named improvement the future state depends on |
Walk the flow in person rather than collecting data by email. Standing at the step is what surfaces the rework loop, the second queue and the spreadsheet nobody mentioned in the written procedure.
The timeline strip is where the argument gets settled. Processing time usually totals minutes while lead time totals days, and dividing one by the other gives process cycle efficiency.
Waiting is the gap the strip exposes, and it belongs to one of the seven wastes: transport, inventory, motion, waiting, overproduction, overprocessing and defects. Mapping makes those categories visible instead of theoretical.
Takt time sets the target pace. Divide available working time by customer demand for the period — and the future state has to deliver at that rhythm or build inventory it does not need.
The Lean Enterprise Institute defines the method as diagramming every step in the material and information flows required to bring a product to the customer, starting with the actual condition of the flow.
The United States Environmental Protection Agency’s lean toolkit calls it a process-mapping method for finding major sources of non-value-added time, used to picture a less wasteful future state before planning later work.
Future-state maps need dates and owners attached or they decay into posters. The usual discipline is a short list of kaizen bursts, each carrying a named owner and a review point.
Maps age quickly. Teams that treat the future state as a standing commitment usually fold it into a continuous improvement culture rather than a one-off workshop.
Examples
The method travels well beyond the factory floor it came from. Three settings make the point clearly: automotive assembly, hospital care delivery, and an offshore back-office team working through insurance claims at volume.
Toyota is the origin. Its plants used material and information flow diagrams to expose where parts waited between operations, which is how the discipline reached the rest of manufacturing through supplier development work.
Virginia Mason Medical Center — a Seattle hospital — adopted the Toyota approach from 2002, mapping care pathways as value streams. Patient waiting between clinical steps behaves exactly like inventory between machines, and the same timeline strip shows it.
Claims operations use it the same way. A team maps intake, verification, adjudication and payment, then finds that a file sits untouched for days between two steps that each take minutes, which is a classic process cycle time finding.
Software delivery teams map the same way. Code waiting for review behaves like stock waiting for a machine, and the timeline strip makes a two-day review queue impossible to argue with.
Service teams often map information flow first. Approvals, queues and handover emails cause more delay than the work itself, so business process improvement projects usually start with the signals rather than the tasks.
Related terms
Value stream mapping sits inside a wider improvement vocabulary. The terms below cover the methods it feeds, the measures it produces and the broader programmes that keep a future state from quietly expiring.
- Lean Six Sigma: the combined method pairing waste removal with statistical variation control.
- Process Mapping: the general practice of diagramming steps, of which this is the lean-specific form.
- Process Cycle Time: the elapsed time from the start of a process to its completion.
- Order Fulfillment Cycle Time: the lead time a customer actually experiences from order to receipt.
- Operational Excellence: the management discipline that keeps improvement running after the workshop ends.
- Continuous Improvement Culture: the everyday habit of small, owned changes rather than periodic projects.
FAQ
What is the difference between a value stream map and a process map?
A process map shows the sequence of tasks, while a value stream map adds information flow, inventory between steps and a timeline that separates processing time from waiting time.
What is takt time?
Takt time is available working time divided by customer demand for that period. It sets the pace the value stream has to run at to meet demand without overproducing.
How long does a mapping exercise take?
Most teams draw a current state in a day or two by walking the flow, then draw a future state in a further session. The implementation plan takes far longer than the drawing.
What are the seven wastes?
Transport, inventory, motion, waiting, overproduction, overprocessing and defects. Value stream mapping makes several of these visible that a task-level process map hides.
What is a kaizen burst?
A kaizen burst is a marked improvement on the future-state map, naming the specific change the new flow depends on and who owns it.
Does value stream mapping work outside manufacturing?
Yes, and healthcare, claims handling and software delivery all use it routinely.
Explore the Outsource Accelerator hubs to find delivery partners who map their own value streams before quoting a service.




 Independent