
A practical guide to HR data analytics

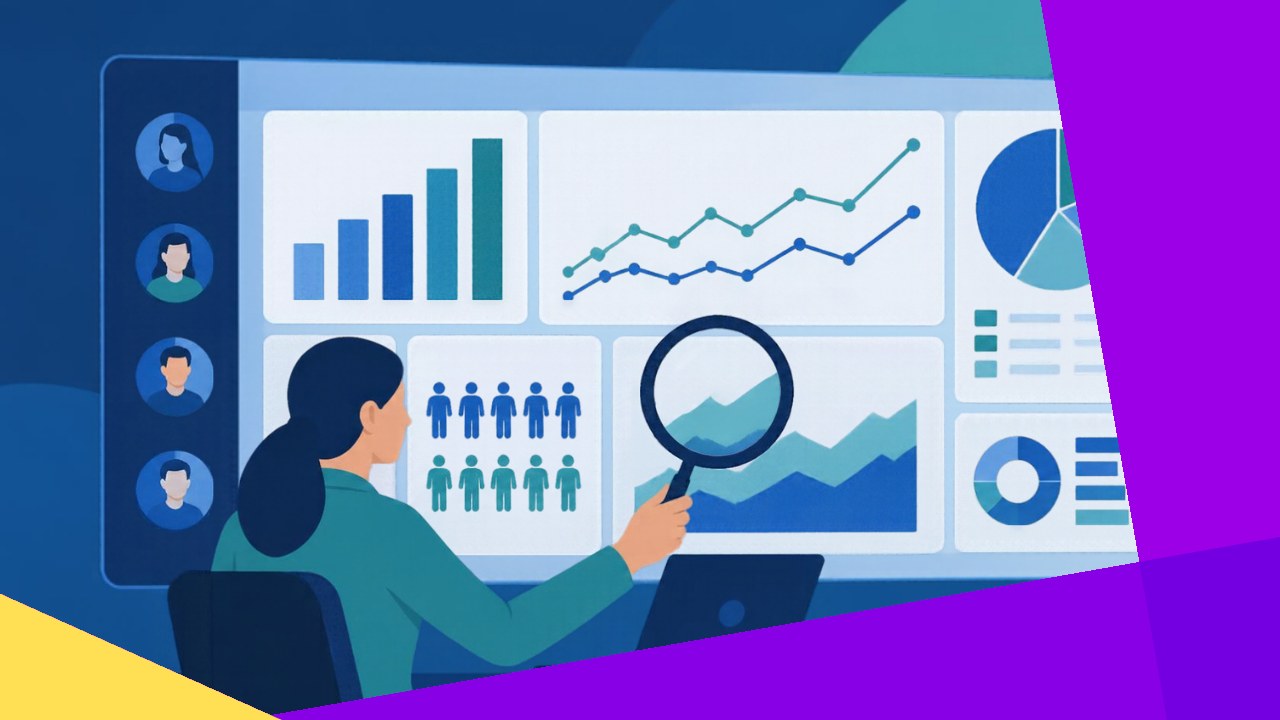
- HR data analytics turns everyday workforce records into clear answers about hiring, retention, and performance.
- The field has three layers: descriptive (what happened), diagnostic (why), and predictive (what comes next).
- You can start small with a few core metrics like turnover, time-to-hire, and engagement before scaling up.
HR data analytics is the practice of collecting workforce information and studying it to make better people decisions. Instead of relying on gut feel, HR teams use numbers to spot patterns in hiring, pay, retention, and performance. The goal is simple: turn scattered records into insight you can act on.
Most companies already sit on plenty of useful data. Payroll systems, applicant trackers, and engagement surveys all generate it daily. The problem is that this information often stays locked in separate tools. Analytics pulls it together so leaders can see the full picture.
This primer covers what the discipline includes, the metrics that matter most, and a practical way to begin. Specific technologies are a separate topic. Here, the focus is the foundation.
What is HR data analytics?
At its core, HR data analytics measures how people join, grow, and leave an organization. It answers questions such as why top performers quit and which hiring sources deliver the best candidates. Because the answers come from evidence, they tend to hold up better than opinions.
The practice is also called people analytics or workforce analytics. What matters is the shift from guesswork to measurement. For example, a manager might assume pay drives most resignations. The data may instead point to limited career growth, and that single insight can reshape a retention plan.
The three types of HR data analytics
Analytics works in layers. Each one builds on the layer before it and answers a different question.
Descriptive analytics
Descriptive analytics tells you what happened. It summarizes past events into headcount reports, turnover rates, and average salaries. This is where almost every team starts, because the data is already on hand. Think of it as the dashboard view of your workforce.
Diagnostic analytics
Diagnostic analytics digs into why something happened. If turnover spiked in one department, this layer helps you find the cause. You might compare exit survey themes, manager ratings, and pay bands. As a result, you move from noticing a problem to understanding it.
Predictive analytics
Predictive analytics looks ahead. It uses historical patterns to estimate future outcomes, such as which employees are likely to resign or how long a role will take to fill. These methods lean on statistics and sometimes machine learning. Many teams explore machine learning models once their basic reporting is solid, since forecasts need clean history to work.
Key HR metrics to track
You do not need dozens of metrics to get value. A short, well-chosen set beats a crowded dashboard nobody reads. Here are three that most teams track first.
Employee turnover rate
Turnover measures the share of staff who leave over a set period. It is the single most watched HR number, because replacing people is costly and disruptive. National data shows how common movement is. In August 2026, for instance, U.S. workers quit at a rate the Bureau of Labor Statistics put at “3.1 million and 1.9 percent, respectively” for the month. Tracking your own rate against that backdrop helps you judge whether churn is normal or a warning sign.
Time-to-hire
Time-to-hire counts the days between a job opening and an accepted offer. A long cycle frustrates candidates and leaves teams short-staffed. When you break the number down by stage, you can see where applications stall and fix that step rather than guess.
Employee engagement
Engagement gauges how committed and motivated your people feel. It links closely to productivity and retention, so it deserves steady attention. The stakes are real: Gallup reports that “global employee engagement fell to 20% in 2025, its lowest level since 2020.” Measuring engagement through regular surveys gives you an early read before problems reach your turnover numbers.
How to get started with HR data analytics
You can begin without a data science team or a big budget. Follow these steps in order.
1. Pick one clear question
Start with a real problem, not a tool. For example, ask why first-year attrition is rising. A focused question keeps your early work useful and easy to explain.
2. Gather and clean the data
Next, pull the relevant records from your HR, payroll, and recruiting systems. Check for duplicates, gaps, and errors before you analyze anything. Messy data leads to wrong conclusions, so this step matters more than it looks.
3. Analyze and visualize
Then study the numbers and turn them into a simple chart. A clear graph often reveals a pattern that a spreadsheet hides. Keep the visual plain so any manager can read it at a glance.
4. Act and review
Finally, share the finding and agree on one change to make. After a few months, measure again to see if it worked. This loop is what turns analysis into results.
Common use cases for HR data analytics
Once the basics are running, the uses grow quickly. Recruiting teams use it to find which sources produce the strongest hires. Retention teams use it to flag flight risks early, often with forecasting methods that score who may leave next.
Other teams apply it to pay equity, checking whether similar roles earn similar money. Learning teams map skills gaps so training budgets go where they count. Some growing companies also hand reporting and payroll data tasks to an outsourcing provider, which frees internal staff to focus on insight. In short, almost any people decision improves when evidence guides it.
Frequently asked questions
Do I need expensive software to begin?
No. Many teams run their first analyses in a basic spreadsheet using data they already own. Dedicated platforms help once your questions grow complex or your headcount climbs into the thousands. Start with what you have, then invest when volume justifies it.
How is HR data analytics different from standard HR reporting?
Reporting states facts, such as last month’s headcount. Analytics explains and predicts, so it tells you why a number moved and what may happen next. A report is a snapshot, while analytics is an ongoing investigation into cause and effect.
Who should own analytics inside the company?
Ownership usually sits with HR, often a people operations or HR business partner role. In larger firms, a dedicated people analytics team handles it. Whoever leads, close ties with finance and IT help, because those teams control much of the source data.
How do we protect employee privacy while using this data?
Limit access to only the people who need it, and anonymize data wherever possible for broad analysis. Be clear with staff about what you collect and why. Strong consent and access rules build the trust that makes any analytics program sustainable.






 Independent





