
Employee turnover statistics to drive your retention strategies


What do employee turnover statistics tell us?
Employee turnover statistics show why workers leave, what it costs, and how the right retention strategies keep your best people on board.
- High turnover drains productivity, knowledge, and money from a company.
- Pay, culture, work-life balance, and recognition are the top reasons people quit.
- Data-driven retention plans help you spot problems early and fix them fast.
High turnover can hurt a company in many ways. For example, when people leave, their skills and know-how walk out the door too. As a result, operations slow down and gaps appear.
Fresh hires also need time to learn the ropes. So projects stall and goals slip. The more often this happens, the higher the cost. In fact, these strains hit the bottom line and pull money away from growth.
This is where employee turnover statistics help. They show the size and shape of the problem. So let us look at the key numbers and what they mean.
Overview of recent employee turnover statistics
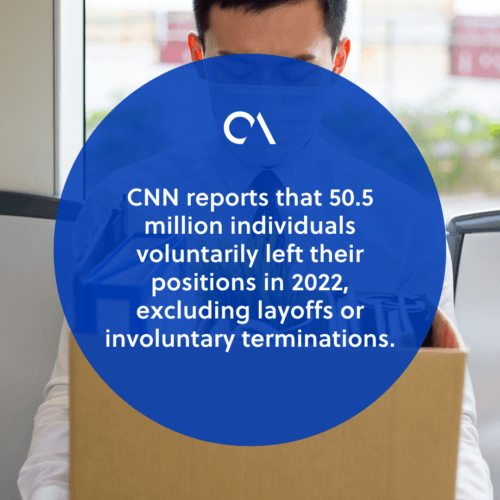
When employees leave, the whole operation feels it. For example, CNN reported that 50.5 million individuals voluntarily left their jobs in 2022, apart from layoffs. In turn, each exit creates a knowledge gap and adds pressure on the staff who stay.
Employee turnover statistics help you find issues and act on them. So a healthy retention rate is worth the effort. In addition, strong retention brings clear wins:
- Lower company costs: Gallup says voluntary turnover costs American firms $1 trillion annually. That is like six to nine months of an employee’s pay.
- Higher effectiveness: The longer people stay, the more skilled they get. As a result, high turnover drags down output.
- Better engagement: Tracking your retention rate month to month shows if your engagement efforts work.
The good news is that the U.S. quit rate (outside farming) stands at 2.5%. Still, a Bankrate study found that 56% of American employees plan to look for a new job, up from 51% the year before.
Some workers may wait out a shaky economy before they resign. However, the fear of layoffs pushes others to start looking sooner. Here are the main reasons why:
- Bankrate’s 2025 Jobs & Pay Report found that 48% of workers plan to job hunt in the year ahead, mostly for better pay.
- The same report shows that 62% say their income has not kept pace with rising living costs and inflation.
- 47% of workers name company culture as the primary factor behind their wish to switch jobs.
- Meanwhile, ThriveMyWay’s research found that about 79% of workers may resign due to too little recognition from their bosses.
In short, these employee turnover statistics point to clear trends. Workers keep scanning the market, mostly for better pay. This tracks with the need for higher income as costs rise. So fair pay, a positive culture, and real recognition all help keep a team in place.
Average employee turnover rates per industry
What counts as a good retention rate? Typically, firms aim for an average retention rate of 90% or higher. So the target is a turnover rate of 10% or lower.
How do you know if your rate is high or low? One simple way is to compare it with your industry’s average. After all, turnover rates differ a lot from one field to the next.
For example, if your rate beats the industry average, your management may need a closer look. In that case, find and fix the internal issues behind it. Here are some turnover rates by industry:
- LinkedIn data shows HR roles had the highest turnover percentages at 14.6%. Meanwhile, admin roles had the lowest at 7.8%.
- Small and mid-sized firms show a turnover rate of 12.0%, above the general average of 10.6%. In contrast, larger firms sit lower at 9.9%.
- Per the NSI National Healthcare Retention Report, the healthcare turnover rate is 22.7%.
- The retail industry struggles with a huge turnover rate of 60%.
- B&FT Online found that 83% of agents in the insurance field leave within three years, and 30% quit within three months.
Voice-heavy fields feel this pain too. For instance, learn how leaders manage call center attrition without burning out their teams.

Employee turnover statistics: Why employees churn
Employee turnover is complex. Job, company, and outside forces all play a part. So understanding them helps you build smarter retention plans. Here are the employee turnover statistics behind why people churn.
Job-related factors
Job factors touch an employee’s daily life. As a result, they shape satisfaction, drive, and loyalty.
Job satisfaction and engagement
Gallup’s State of the Global Workplace report found that 65% of the U.S. workforce lacks engagement. This is a big turnover driver. After all, disengaged staff are more likely to look elsewhere.
Another Pew Research study found that about 40% of people who quit left due to excessive hours. Meanwhile, 30% pointed to too few hours. So burnout and poor growth prospects both push people out. Strong employee engagement programs can ease this pressure.
Compensation and benefits
Business News Daily reported that most people who quit and found new work say they found more fulfilling work. Among them, 56% now earn more, with better chances to move up. As a result, when pay and perks fall short, people explore other options.
Work-life balance
A Work Institute report found that quits tied to work-life balance rose by 20%. Now 12 out of every 100 workers cite this reason. Within this group, scheduling and commuting cause the most exits. In fact, commuting-related quits jumped 403% over ten years. So flexible and healthy work-life balance options help prevent turnover.
Organizational factors
These cover the wider work setting. For example, culture, leadership, and growth chances all shape how long people stay.
Company culture and values
A LinkedIn study found that 61% of American employees were changing their current employment. The urge to leave runs highest among Gen Z (ages 18 to 25) and millennials (ages 26 to 41). So a gap between personal values and company culture drives many exits. Some quiet exits look a lot like quiet quitting, where people disengage before they resign.
Leadership and management styles
A Pew Research report found that weak career growth and feeling undervalued push many Americans to quit. In fact, 63% said they felt undervalued. So poor leadership and a lack of respect can erode morale and send people looking for better managers.

External factors
Internal issues matter most, but outside forces count too. For example, the economy, new tech, and industry trends all affect how secure people feel.
Economic conditions
A ManpowerGroup study found that 84% of employers struggled to fill roles, a 20% jump from the prior year. A related report showed that 77% of employers still face staffing trouble. So this talent shortage can push workers to seek new roles when the economy allows.
Technological advancements
Recent robotics data suggests that by 2030, about 90% of companies plan to adopt robotic automation. This trend raises questions about its impact on human employment. As a result, the fear of being replaced can push people toward safer fields. In short, as firms automate more tasks, job security stays top of mind for many workers.
Address your churn rate with these employee turnover statistics
To tackle high churn, companies need data-driven retention plans. So the first step is to run regular employee surveys. These reveal how people feel about pay, balance, and growth.
Next, compare your employee turnover statistics with industry benchmarks. So you can pinpoint weak spots and target your efforts. Finally, invest in strong training that builds better leaders and a healthy culture. As a result, your best people are far more likely to stay.
Frequently asked questions about employee turnover statistics
What is a good employee turnover rate?
Most firms aim for a turnover rate of 10% or lower. That lines up with a retention rate of about 90%. Still, the ideal number varies by industry.
What are the top reasons employees quit?
Pay is the leading reason, followed by weak culture, poor work-life balance, and too little recognition. Feeling undervalued also drives many exits.
How much does employee turnover cost?
Gallup estimates that voluntary turnover costs U.S. firms about $1 trillion each year. For one worker, that can equal six to nine months of pay.
Which industries have the highest turnover?
Retail sees very high turnover, near 60%. Healthcare and insurance sales also run high. In contrast, admin roles tend to stay lower.
How can companies reduce turnover?
Start with fair pay and a positive culture. Then add growth paths, flexible schedules, and real recognition. Regular surveys help you act before people leave.
Key takeaways
- Employee turnover statistics reveal why people leave and what it costs.
- Pay, culture, work-life balance, and recognition drive most exits.
- Voluntary turnover costs U.S. firms roughly $1 trillion each year.
- Turnover rates vary widely, so compare yours with your industry’s average.
- Surveys, benchmarks, and better leadership help keep your best people.






 Independent





